flowchart LR
  ADA(Axis)
  ADA -->ADAA(lim):::api
  ADA -->ADAB(lab):::api
  ADA -->ADAC(coord_flip)
  ADA -->ADAD(scale)

  classDef api fill:#f96,color:#fff
19 Modifying the axes
Tip
Here let us focus on two families of useful helpers that let you make the most common modifications. xlab() and ylab() modify the \(x\)- and \(y\)-axis labels:
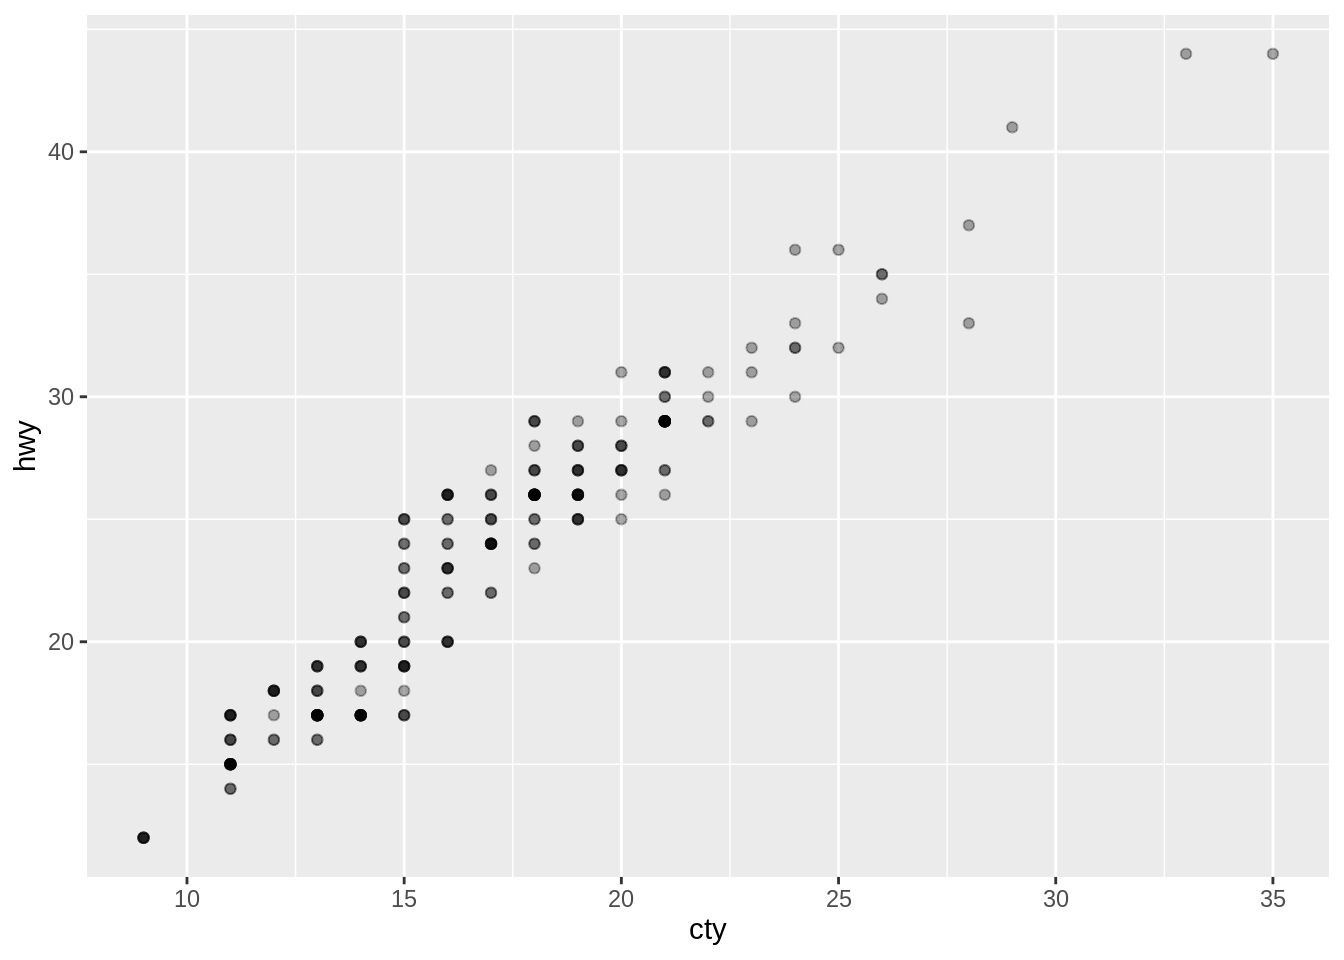
ggplot(mpg, aes(x = cty, y = hwy)) +
geom_point(alpha = 1 / 3) +
xlab("city driving (mpg)") +
ylab("highway driving (mpg)")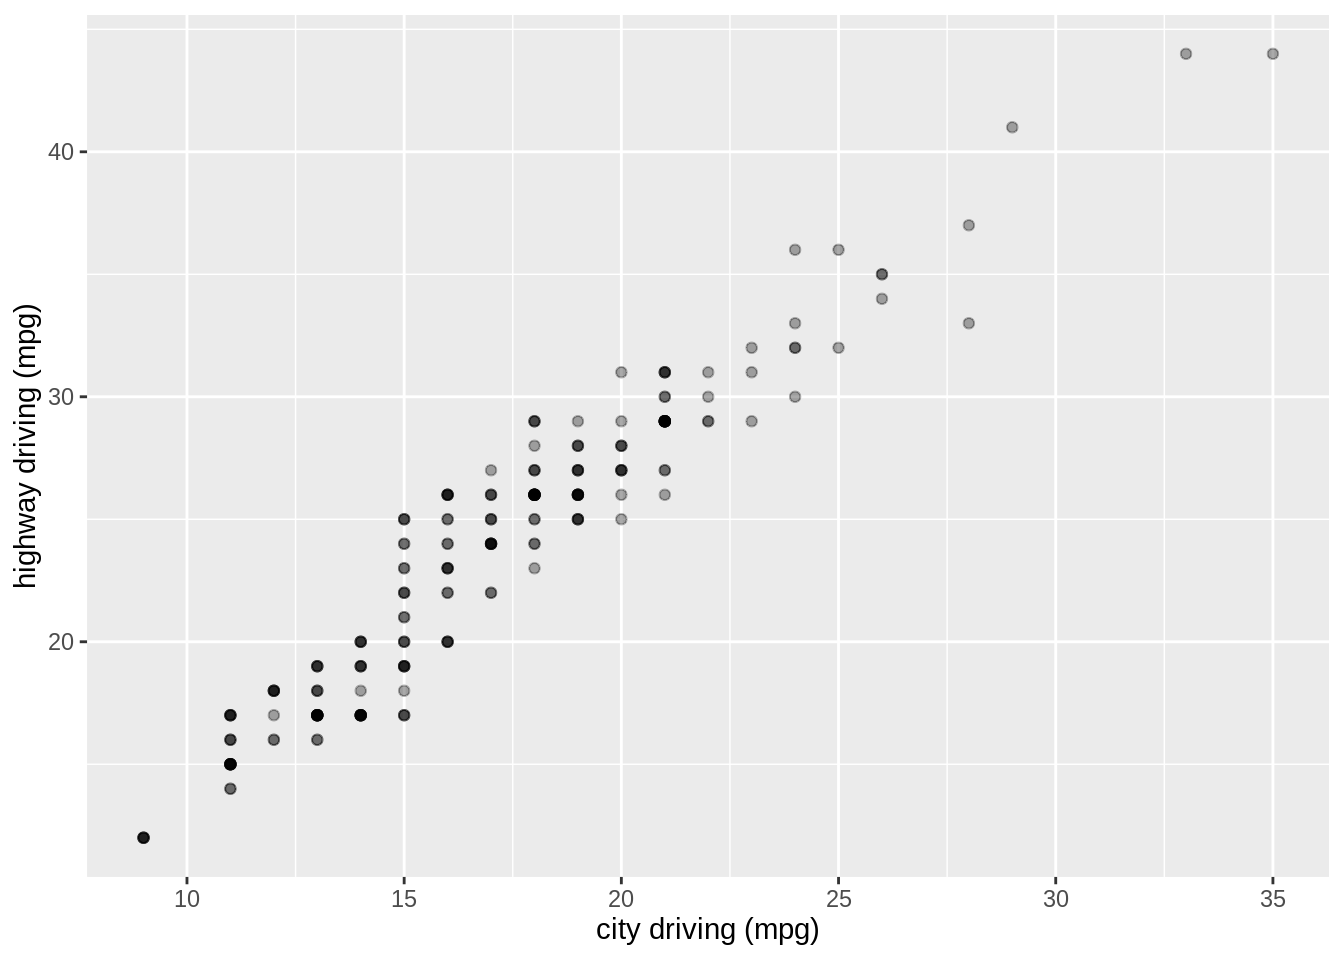
# Remove the axis labels with NULL
ggplot(mpg, aes(x = cty, y = hwy)) +
  geom_point(alpha = 1 / 3) +
  xlab(NULL) +
  ylab(NULL)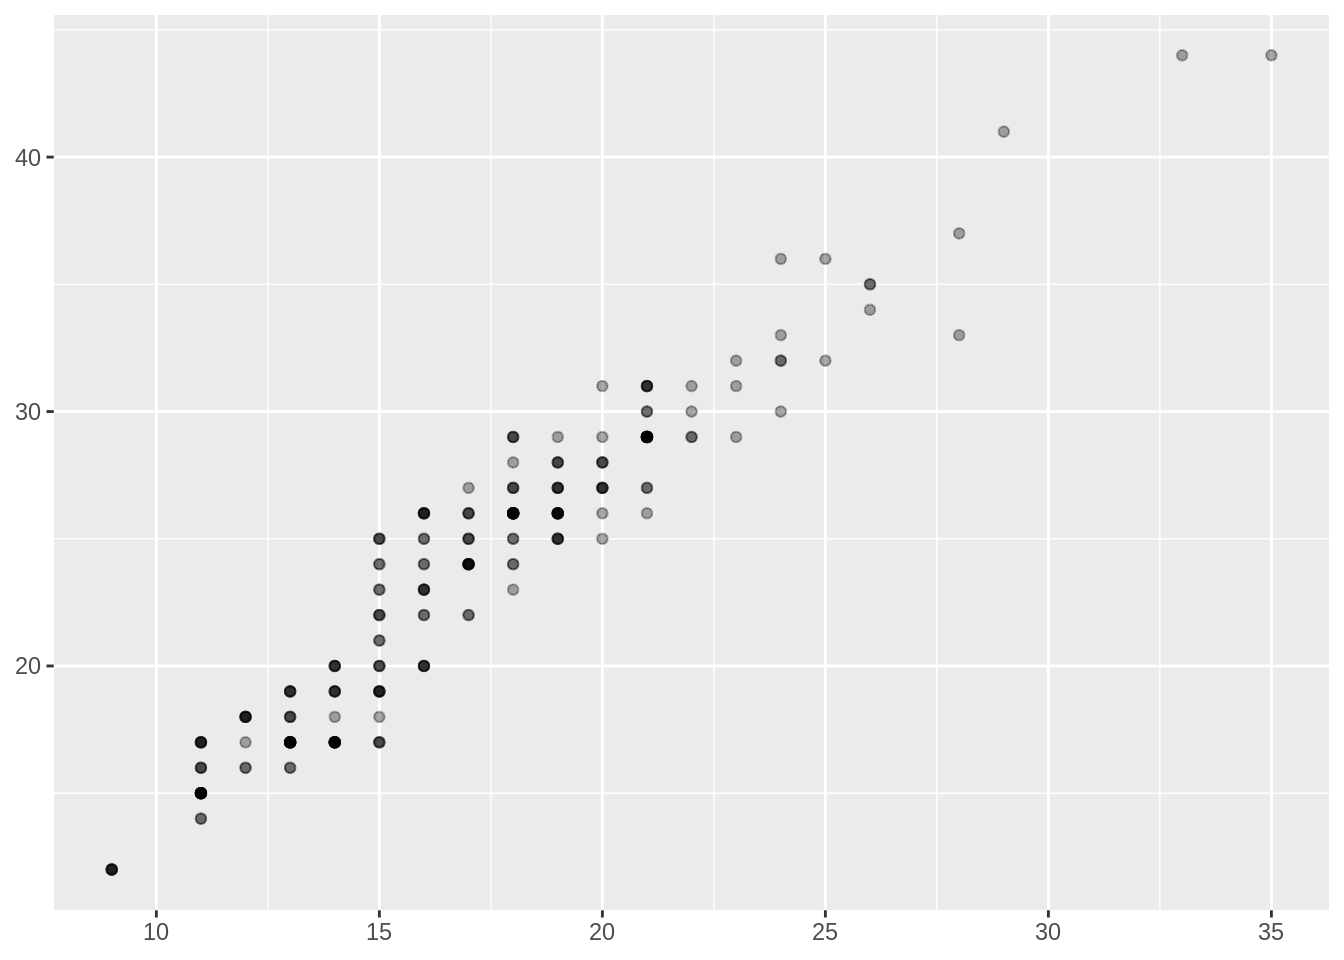
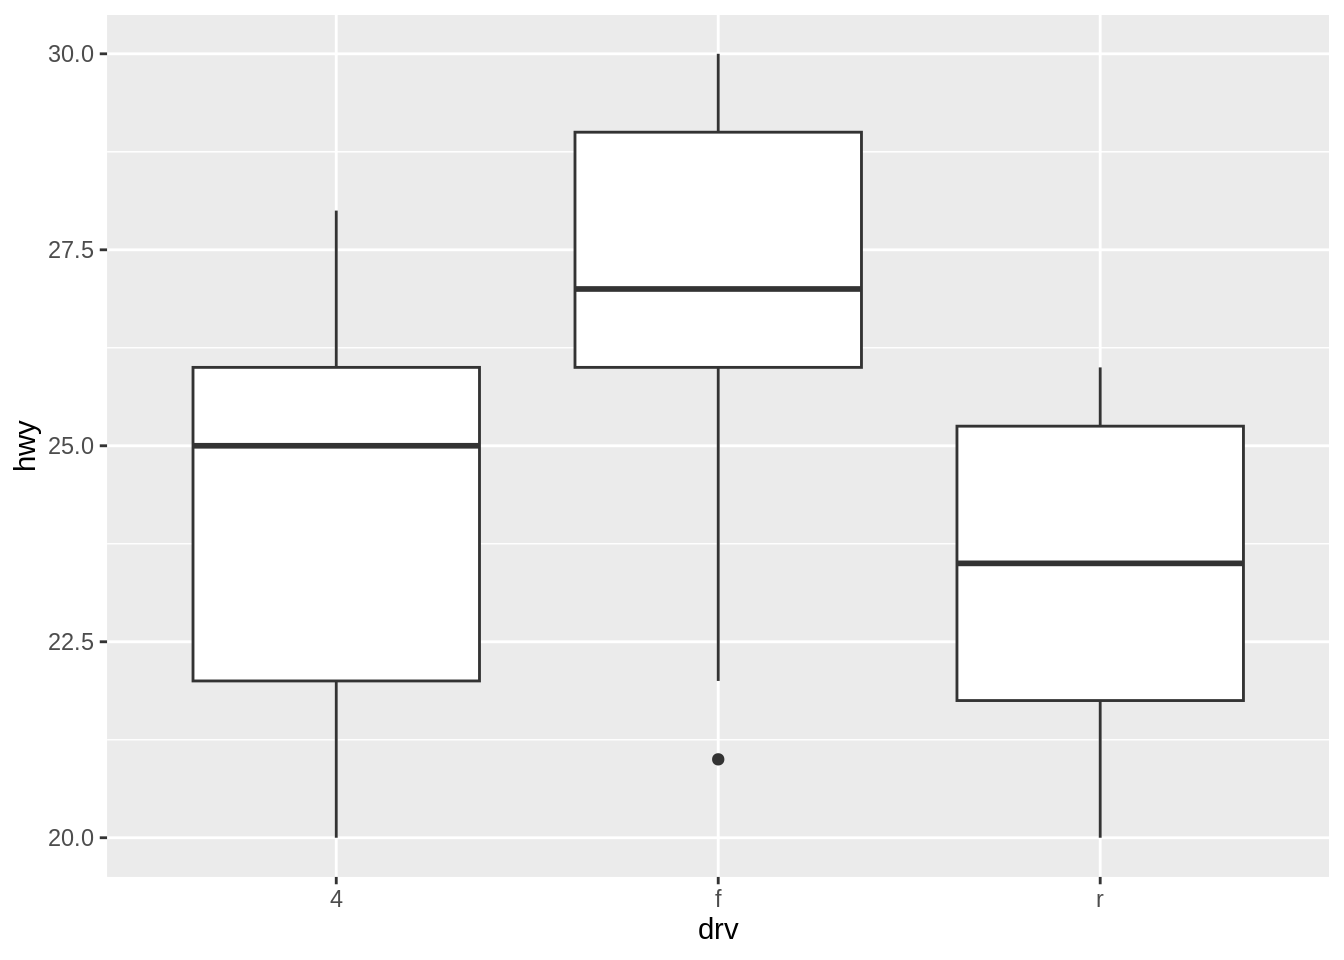
xlim() and ylim() modify the limits of axes:
# Use NA for the lower limit in ylim() to automatically calculate
# it based on the minimum value in the data,
# while setting the upper limit to 30.
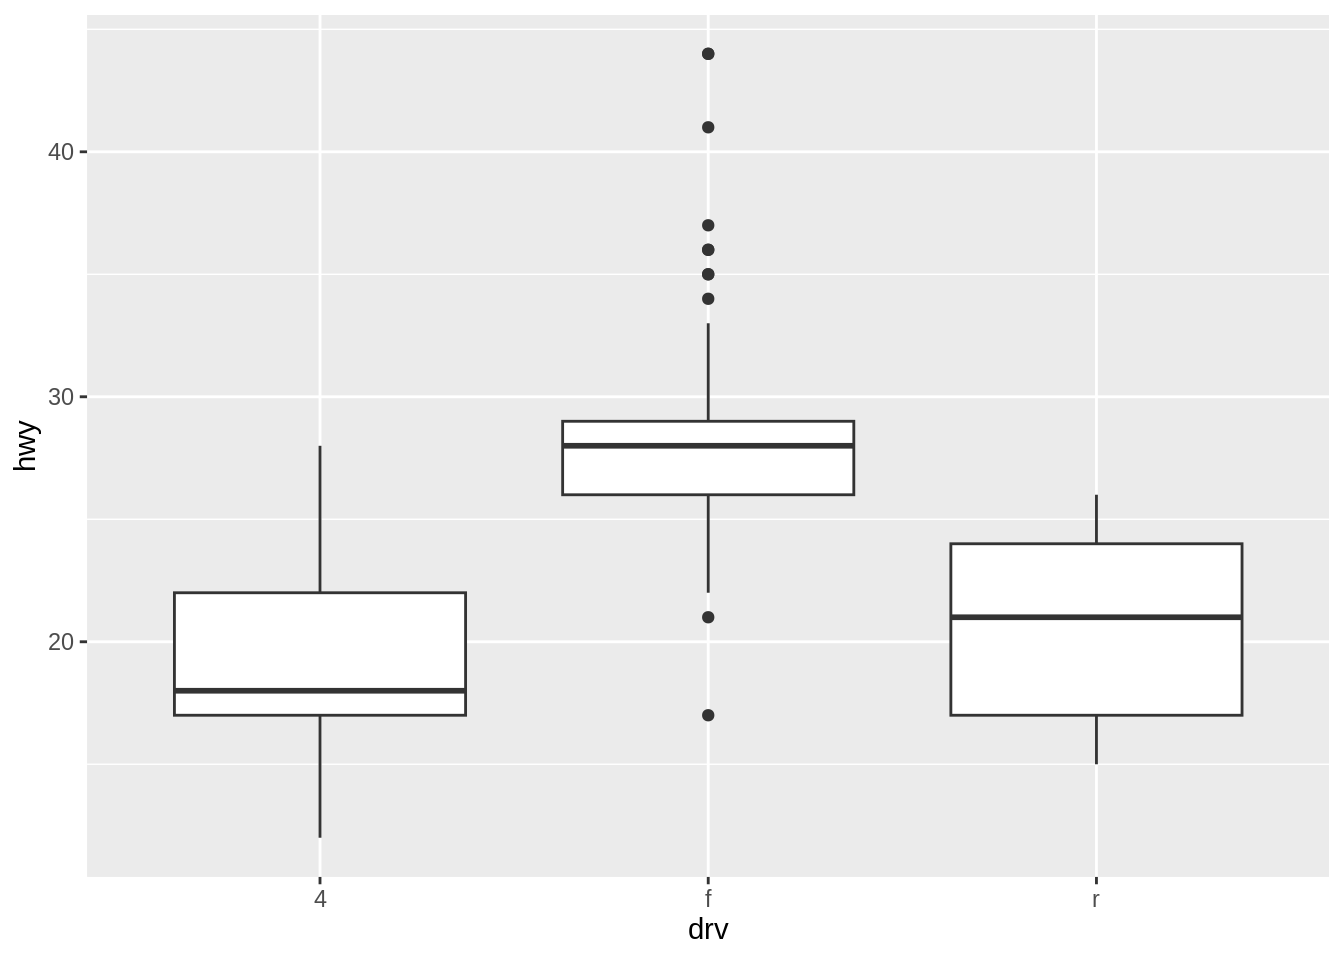
ggplot(mpg, aes(x = drv, y = hwy)) +
geom_boxplot() +
ylim(NA, 30)
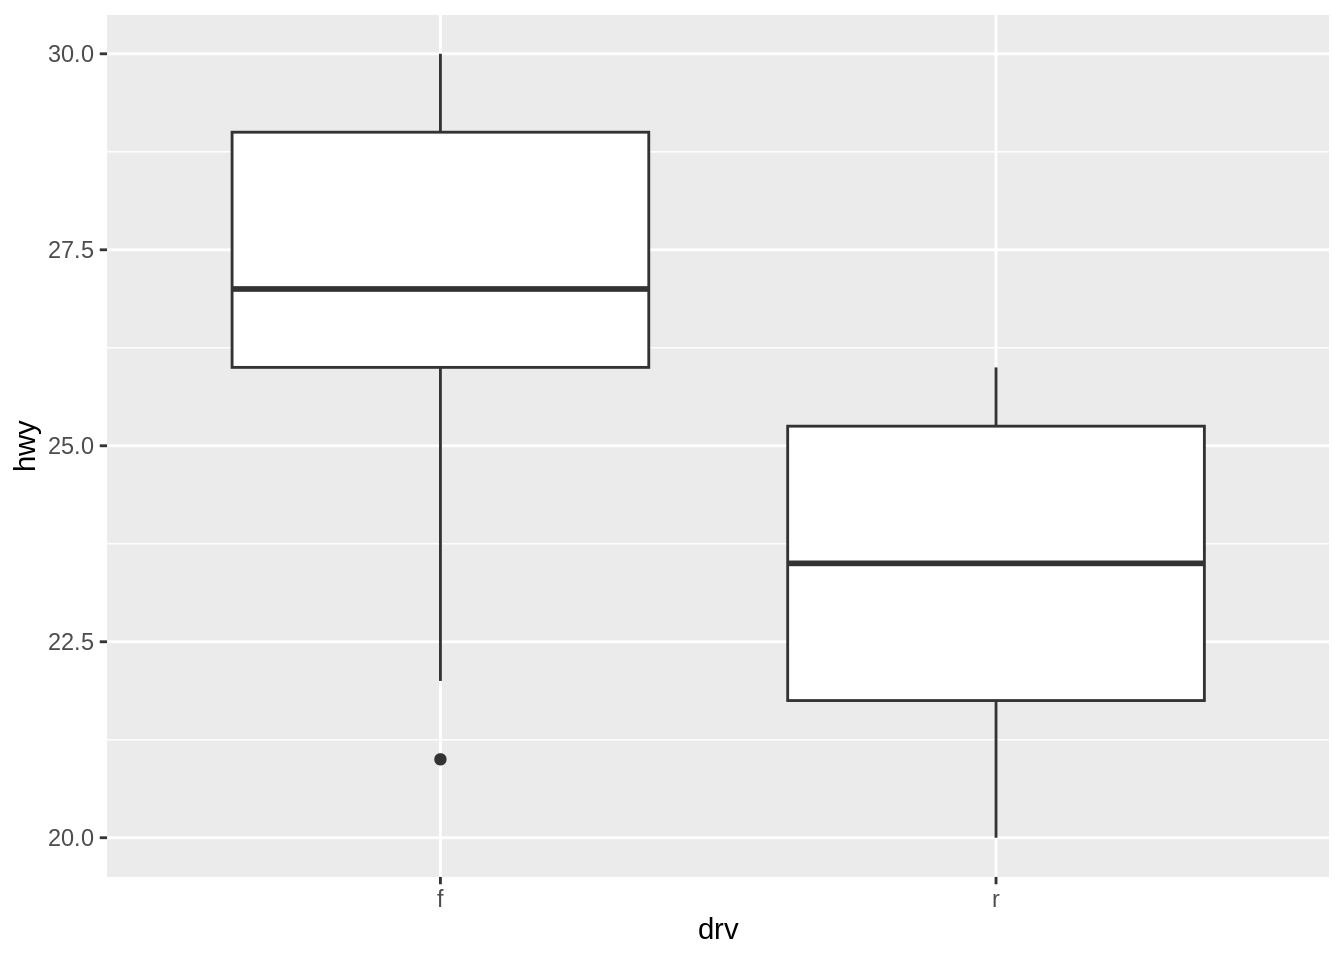
Changing the axis limits in ggplot2 converts values outside the specified range to NA. To suppress warnings associated with these NA values, you can use na.rm = TRUE. However, exercise caution: this conversion to NA occurs before the computation of summary statistics like the sample mean. As a result, it may affect the accuracy of these statistics, leading to potentially misleading interpretations.
# This plot ylim to restrict the y-axis from 20 to 30,
# suppressing NA-related warnings with na.rm = TRUE.
ggplot(mpg, aes(x = drv, y = hwy)) +
  geom_boxplot(na.rm = TRUE) +
  ylim(20, 30)