30 Data Understanding
In the realm of data science, a significant portion of time is devoted to sourcing relevant data and preparing it for predictive analysis. This process is crucial, especially in supervised learning, where the model’s success hinges on the availability of a labeled dataset that accurately represents the problem. For instance, if we aim to predict restaurant wait times, we’d need a dataset with entries for each order, marked with the actual wait time experienced by the customers. Sometimes, it might be necessary to enhance existing data collection methods, such as implementing a system to track the time from order placement to food delivery.
To locate, understand, and assess the quality of the data sources needed to answer the research question. You should consider:
- Identify potential data sources such as databases, APIs (Application Programming Interface), surveys, or publicly available datasets.
- Understand the variables and observations in the dataset, including the type of data (numerical, categorical), the scale of measurement, and any coding schemes used.
- Assess the completeness, correctness, and relevance of the data to ensure it’s suitable for your analysis.
Poll Time
Setting up a robust data recording system and compiling sufficient data for training demands substantial effort and time. Once the data is collected, the next crucial step is to thoroughly understand it, which will guide the choice of an appropriate model and help interpret the outputs effectively. Initial steps typically include:
- Calculating descriptive statistics: Assess means and medians to grasp the distribution.
- Determining percentiles: This helps in understanding the spread and key cutoffs within the data.
- Analyzing correlations: Identifying relationships among variables can provide insights into potential features for the model.
Visualizing the data is equally important. Techniques might include:
- Box plots: Useful for comparing distributions and spotting outliers.
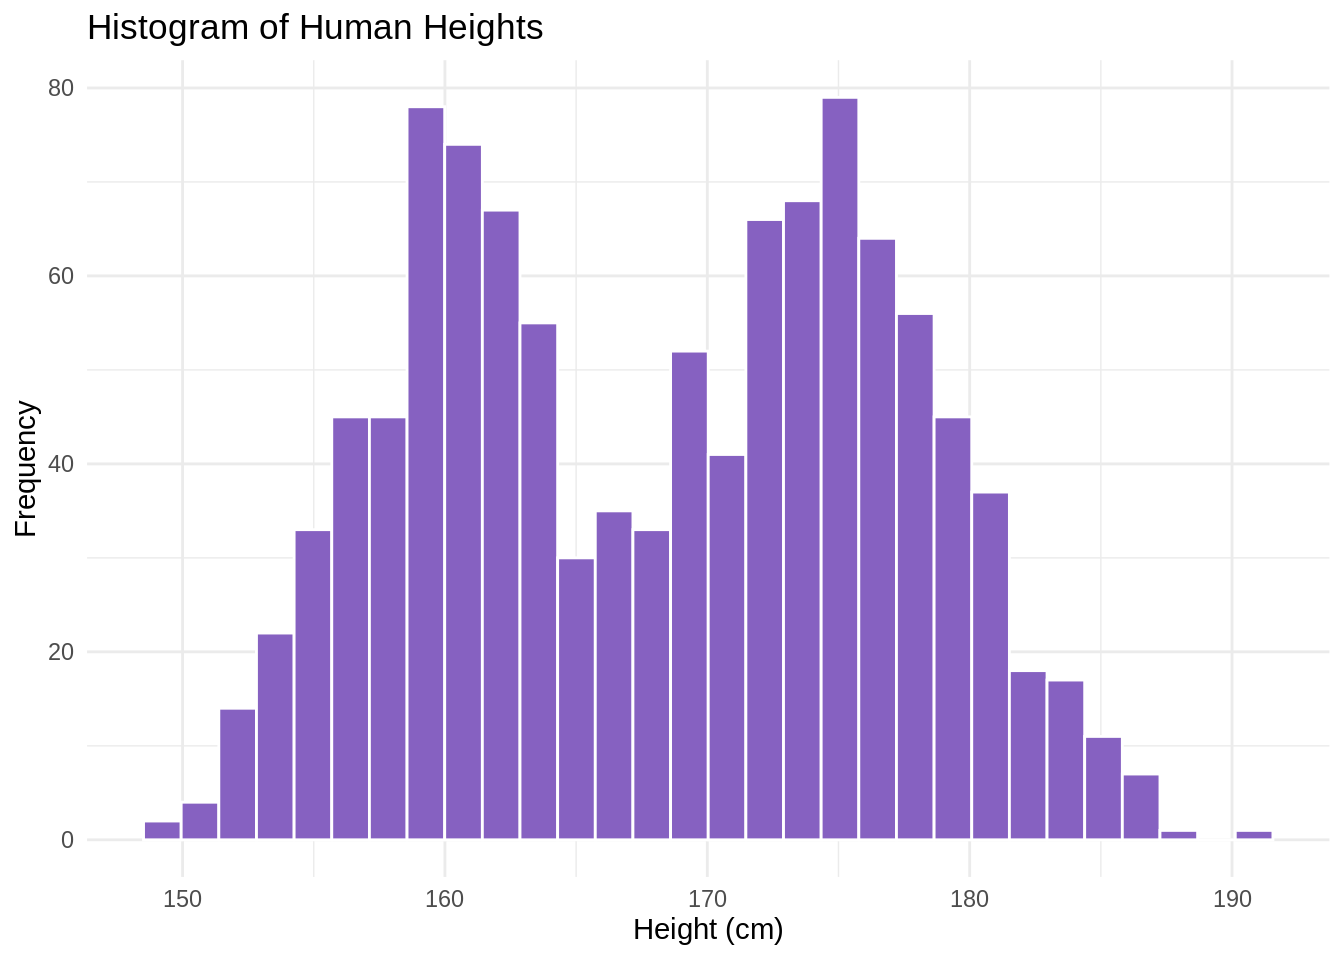
- Histograms: Help reveal the basic structure of the data, such as the distribution of wait times.
- Scatter plots: Ideal for examining relationships between different variables.
For example, analyzing the human heights data might reveal an average of 168.3 cm. However, a histogram could show a bimodal distribution, with one cluster around 160 cm and another around 170 cm. This insight could lead to a refinement of the research question or model strategy. Perhaps the model could be designed to classify data points into ‘female’ or ‘male’ heights based on factors like parental heights, dietary quality, caloric intake.
Understanding these dynamics is crucial because if our model simply predicts average heights around 168.3 cm, it ignores the true structure of the data, potentially leading to inaccurate or misleading predictions. Thus, the phase of finding and understanding data is not just about collection but about laying a solid groundwork for the predictive modeling that follows.